
Ronny Kohavi — Stanford PhD, Ex-VP and Technical Fellow at Airbnb, formerly Microsoft and Amazon — is one of the top cited researchers in Computer Science and a leading voice in experimentation. He recently joined Luke Sonnet, Head of Experimentation at GrowthBook, for a webinar sharing best practices, mistakes to avoid, and surprising insights into how often experiments actually succeed. The full webinar recording is available here.
This article covers the key principles Ronny and Luke shared for designing experiments that drive long-term growth — from understanding the importance of experimentation, why you shouldn’t ship on flat results, the key metrics you should track, and how to create a shipping criteria framework. Whether you're just getting started with experimentation or looking to sharpen how your team makes decisions, these are the foundational concepts that separate programs that deliver real impact.
In science, randomized controlled experiments are the gold standard, sitting at the top of the hierarchy of evidence. A/B tests are the online equivalent and the most reliable tools teams have for determining whether a change actually has an effect — whether that's a new feature, a UI change, a pricing change, or a backend optimization.
The problem is that most teams haven't done the harder work first: agreeing on what success actually looks like before the data comes in. Without that foundation, even a well-run experiment produces a result nobody knows how to act on.
Experimentation is How You Stop Guessing: Embrace the High Failure Rate
Humans are systematically bad at predicting what will work and assessing the value of ideas. You cannot reliably judge which ideas are valuable before testing and will be wrong far more often than most teams expect. An effective experimentation program is critical for focusing effort toward what actually works.
Here are some surprising success rate data from across the industry:
Company | Experiment Success Rate | False Positive Risk | Reference |
| Microsoft | 33% | 5.9% | Kohavi, Crook and Longbotham 2009 |
| Avinash Kaushik | 20% | 11.1% | Kaushik 2006 |
| Bing | 15% | 15% | Kohavi, Deng and Longbotham, et al. 2014 |
| Booking.com | 10% | 22% | Manzi 2012, Thomke 2020, Moran 2007 |
| Google Ads | 10% | 22% | Manzi 2012, Thomke 2020, Moran 2007 |
| Netflix | 10% | 22% | Manzi 2012, Thomke 2020, Moran 2007 |
Microsoft's 33% success rate stands out, but this came at a cost. Significant upfront work went into scoping and refining ideas before they ever entered an experiment, which directly impacted that number.
The median organization sees roughly 10% of experiments move the metrics they were designed to improve. Given this success rate, we can compute the False Positive Risk (FPR) — the probability that a statistically significant result is actually a false positive. At a 10% success rate with standard thresholds (𝛼=0.05, 80% power), that risk is around 22%, meaning roughly 1 in 5 'successful' experiments are actually false positives. Most teams assume p < 0.05 means they will rarely make mistakes, but the math shows otherwise.
The most impactful teams are the ones with the infrastructure to test fast and realign priorities based on evidence. A $120M improvement at Bing sat in the backlog for months because nobody thought it was worth testing. At Airbnb, the biggest win was a one-line code change. Neither of these could have been predicted. Both required running the experiment.
The Importance of Building–and Aligning on–A/B Testing Key Metrics
An experimentation program is only as good as the metrics it optimizes for. These metrics include:
- Success or goal metrics: Defines why an organization or product exists and what success looks like (stock price, revenue, market share, etc.) These are the real objectives, but are not easy to move or measure in the short-term.
- Driver metrics: Short-term metrics that are the signals believed to predict movement in success metrics. These are what you actually measure to signal success.
- Overall Evaluation Criterion (OEC): The weighted combination the organization agrees to optimize for, typically composed of a few success and driver metrics. Defining a good OEC is one of the hardest and most important things an experimentation program does.
What Goes Wrong Without a Good OEC
Real-world scenarios from search engines (Bing, Google) and booking sites (Airbnb, VRBO) illustrate how badly things can go wrong with poor OECs, despite well-meaning intentions.
The Search Engine Example
At Bing, naively using queries per user as the OEC would have led to very poor decisions. The example he gave was a ranking bug that returned terrible search results. This increased queries by 10% due to users reformulating queries several times and increased ad revenue by 30%. The short-term metrics look great, but the product is broken.
More optimal metrics to track here would be to minimize queries per session (users should be able to find answers quickly) and maximize sessions per user (repeat usage indicates high value). Bing has a suite of metrics they actually track, including sessions per user, queries per user, time to success, revenue per user and more. We'll cover a framework for identifying and aligning on good OECs later in the article.
A Booking Site Example
Similarly, a booking platform such as Airbnb that ignores satisfaction signals like user rating and instead optimizes purely for conversion rate is optimizing for the wrong thing. If users book listings they end up hating, they don't return.
A better OEC would also include a measure of satisfaction, such as the user's star rating, so you can build machine learning models that predict whether this user will book a listing they love and rate five stars. Deciding on the trade-off between multiple metrics, such as revenue and user satisfaction, is a key business decision.
The Flat Result Trap: The Most Expensive Mistake in Product
Getting your OECs right is important, but only if you're willing to act on what the data actually tells you. A flat result means an experiment didn't produce a statistically significant improvement in the OEC. Shipping flat means deploying that feature anyway. It was discussed that this is a decision error in nearly every case.
One example from Bing was a major effort with ~100 engineers to introduce a third pane to the search window. The experiments failed to show value, but it shipped to all users anyway because it was determined to be a strategic business move. A year later after countless additional experiments failed to show value, the 3rd pane was rolled back at significant costs to Bing.
Had Bing acted on what the data told them to begin with, they could have failed much faster, avoiding months of sunk cost and instead redirected their engineering resources toward something that actually moved the needle.
Debunked: Common Justifications for Shipping Flat
Ronny shared the four primary reasons he has seen teams use to rationalize the decision to ship flat and dives into the real implications of each.
Justification #1: It’s flat, we’re not hurting the users or business
A flat result doesn't mean no effect exists. All it tells you is “we didn’t find enough evidence of an effect.” The experiment could simply be underpowered. "Not statistically significantly worse" is not the same as safe to ship. The true effect could still be negative.
Justification #2: Team morale depends on shipping:
Shipping a flat feature to protect morale means celebrating shipping rather than actually moving goal metrics, which can also complicate the codebase and require maintenance costs. The culture should be results-oriented and simply recognize that many ideas fail. Hold a learning review, share what was discovered, and move on. Failures that generate learning are worth celebrating.
Justification #3: It’s an enabler for future work:
You can cut through this justification with one question: if we ship this and deprecate the old version, would we ever roll it back? At Bing, the answer was yes. Every flat enabler that ships becomes code that must be maintained and a foundation you'll keep building on even when the follow-on value never arrives.
Justification #4: It’s strategic:
Strategic conviction is not a substitute for evidence, and as the data shows, even small changes are hard to predict correctly. Set a vision, but move toward it in small, testable steps. Test a meaningful component first, get data, then adjust.
A Framework for Making Better Experimentation Decisions
With the importance of good metrics and understanding of what can go wrong without them clearly laid out, the conversation then shifts to a practical approach for building a decision framework that connects short-term measurements to long-term goals without overcomplicating the process.
Bridging Short-Term Experimentation Metrics to Long-Term Goals
The messy reality is that most measurable short-term metrics don’t align 1:1 with business goals, so we must instead build frameworks to do so.
Start by identifying your long-term goals and what you can actually measure. From there, identify the short-term metrics that are the strongest indicators of those long-term goals. These are the signals that move in the right direction when the product or business is genuinely improving.
Once you've identified the right metrics, put guardrails in place. Guardrails are secondary metrics you monitor to ensure that improving your primary metric isn't coming at the expense of something else that matters, such as revenue, retention, or user satisfaction. They don't have to move, but they can't go backwards.
A word of caution: overcomplicating things and tracking too many metrics can make it difficult to act. Before running an experiment, think critically about what you would do if your metrics told conflicting stories afterward. This exercise forces clarity around prioritization and how you make business decisions around tradeoffs. The goal is to identify the key signals you can build a decision framework around so you know exactly how you'll act on them.
A Real-World Shipping Example: LLM Chatbots
An example that highlights this concept is an AI chatbot company. They can't measure customer lifetime value in a two-week experiment. Instead, they’ll need to look at the short-term metrics that signal value, such as distinct sessions per user, topic breadth, short-term subscription conversion, and how often responses are copied externally. Build a framework connecting these to the long-term goal, validate against historical data, and you have an OEC you can actually experiment on.
But throwing all of these metrics into your results dashboard can complicate the picture. If some results are flat or vaguely negative, while others are statsig negative, and others are statsig positive, then how do you make a shipping decision?
This is exactly where clearly defined shipping criteria earns its value.
Shipping Criteria: Enabling Independent Shipping Decisions at Scale
Translate your metrics into explicit shipping criteria that are determined prior to an experiment launching. This is a decision framework that enables independent shipping decisions and eliminates bias from decision-making during the evaluation phase.
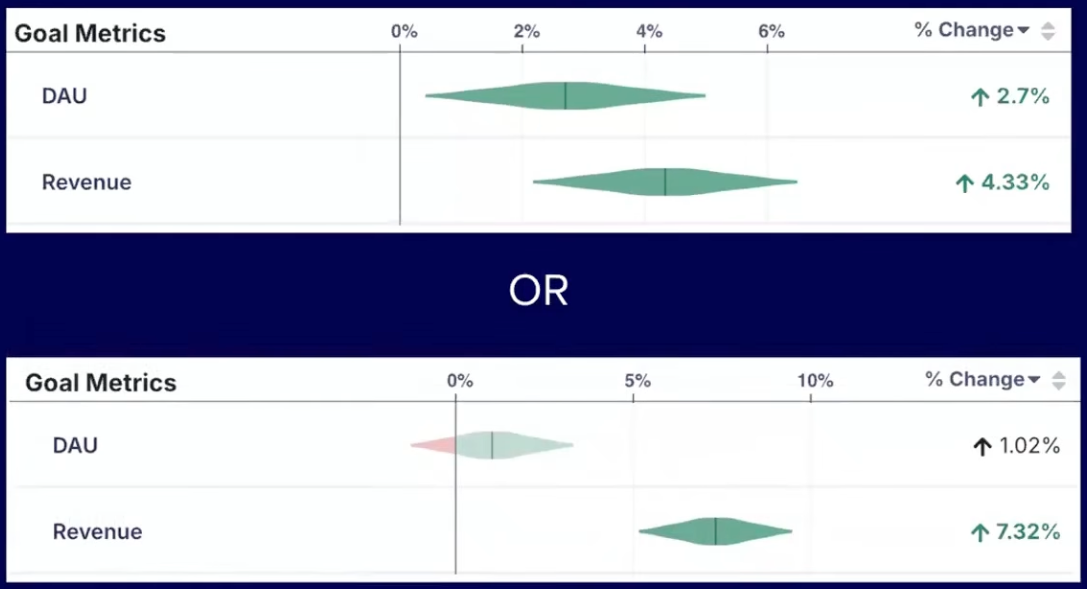
Some decisions are very straightforward, such as the example below. With the revenue change being equal, you would choose the latter with higher Daily Active Users.

However, a clearly defined framework for shipping criteria becomes increasingly necessary in situations where metrics conflict, such as in the example below, where DAU is higher in the first experiment, but revenue is higher in the second. In this situation, you need to understand the tradeoff between these metrics that you’re willing to accept when shipping.
This approach encodes your decision-makers' preferences into a repeatable framework so shipping decisions are consistent, defensible, and free from bias.
Luke’s Twitter Example
An example from Twitter highlights how this works in practice. Daily Active Users (DAU) was a key metric for Twitter, but they wanted to make sure that people were using the product repeatedly and over time to see that they're getting value out of it in a wide variety of applications. Some of the measured indicators included tweets created, likes, and other forms of engagement. They used the decision framework below to determine when to ship:
- If DAU is up and stat sig → ship
- If DAU is negative → rollback
- If DAU is up, not stat sig and no guardrails are negative:
- If engagement metrics are up (tweets created, likes, etc.) → ship
- Otherwise → experiment review
- Murky results → rollback
This type of framework scales. It forces tradeoffs to be agreed on before you're under pressure from a live result.
A key note to remember is that your metric models will likely drift over time. This is something teams need to revisit regularly as their product and business evolves. The metrics that predicted success a few months ago may not be the right ones today.
Closing: Shift the Experimentation Culture
Ronny and Luke close with a shared belief: the teams that win at experimentation aren’t always the ones with the most resources or sophisticated tools, but the ones that have built a culture around learning.
The most important piece of advice is to shift the organizational mindset from celebrating shipping to celebrating learning. Most ideas will fail. The teams that internalize this stop treating failed experiments as something to hide and start treating them as the mechanism by which they get smarter and faster over time.
That cultural shift is supported by the practical framework Luke outlined. When you have clearly defined metrics, explicit shipping criteria, and a shared understanding of your tradeoffs, experimentation becomes the foundation for confident, independent decision-making at scale.
Key Takeaways
- Most experiments fail. The median industry success rate is ~10%, meaning you will be wrong far more often than you expect. An effective experimentation program is how you find what actually works.
- False positive risk is higher than most teams realize. At a 10% success rate, roughly 1 in 5 "winning" experiments are actually false positives, even when running at p < 0.05.
- Your experimentation program is only as good as the metrics it optimizes for. Poorly defined OECs lead to decisions that look good on paper, but break the product.
- Shipping flat is a decision error in nearly every case. "Not statistically significantly worse" is not the same as safe to ship. The true effect could be negative and the code will have maintenance costs.
- Short-term metrics rarely align 1:1 with long-term business goals. Build an explicit framework connecting the two and put guardrails in place to protect what actually matters.
- Define your shipping criteria before the experiment runs, not after. This eliminates bias, enables independent decision-making, and forces tradeoffs to be agreed on in advance.
- Shift the culture from celebrating shipping to celebrating learning. The teams that win at experimentation are the ones that treat failed experiments as the mechanism by which they get smarter.
Want to go deeper? Ronny teaches two online courses on Maven
Accelerating Innovation with A/B Testing: Ronny’s flagship course and recommended starting point for most practitioners
Advanced Topics in A/B Testing: A follow-on to Accelerating Innovation with A/B Testing for practitioners with a solid foundation in p-values, statistical power, and OEC design


