Michael and Ryan explore SQL Explorer
Sometimes you need to scratch your own itch. And, when you do, it’s sooo good.
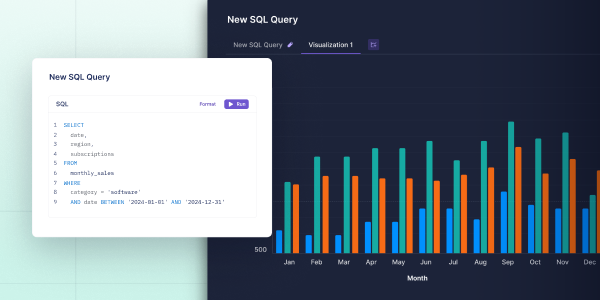
That’s what happened with our newest feature, SQL Explorer.
We found ourselves in GrowthBook always needing to run some kind of basic SQL query like checking on feature usage. It meant having to open another tool (Mode in our case) and running the query there, getting the data, and then heading back to GrowthBook. That context switching is tedious, and, if you’re not careful, you’ll find yourself in a totally different tab, reading AITAH posts.
Well, we just got a whole lot more time back because you can now run those queries right in GrowthBook with our new SQL Explorer. Its adoption has already been through the roof, so if you’re not using it, you’re likely missing out on one of our most useful new features. It’s even got us thinking: “Do we need Mode any more?”
Here are 3 common use cases to help you get started.
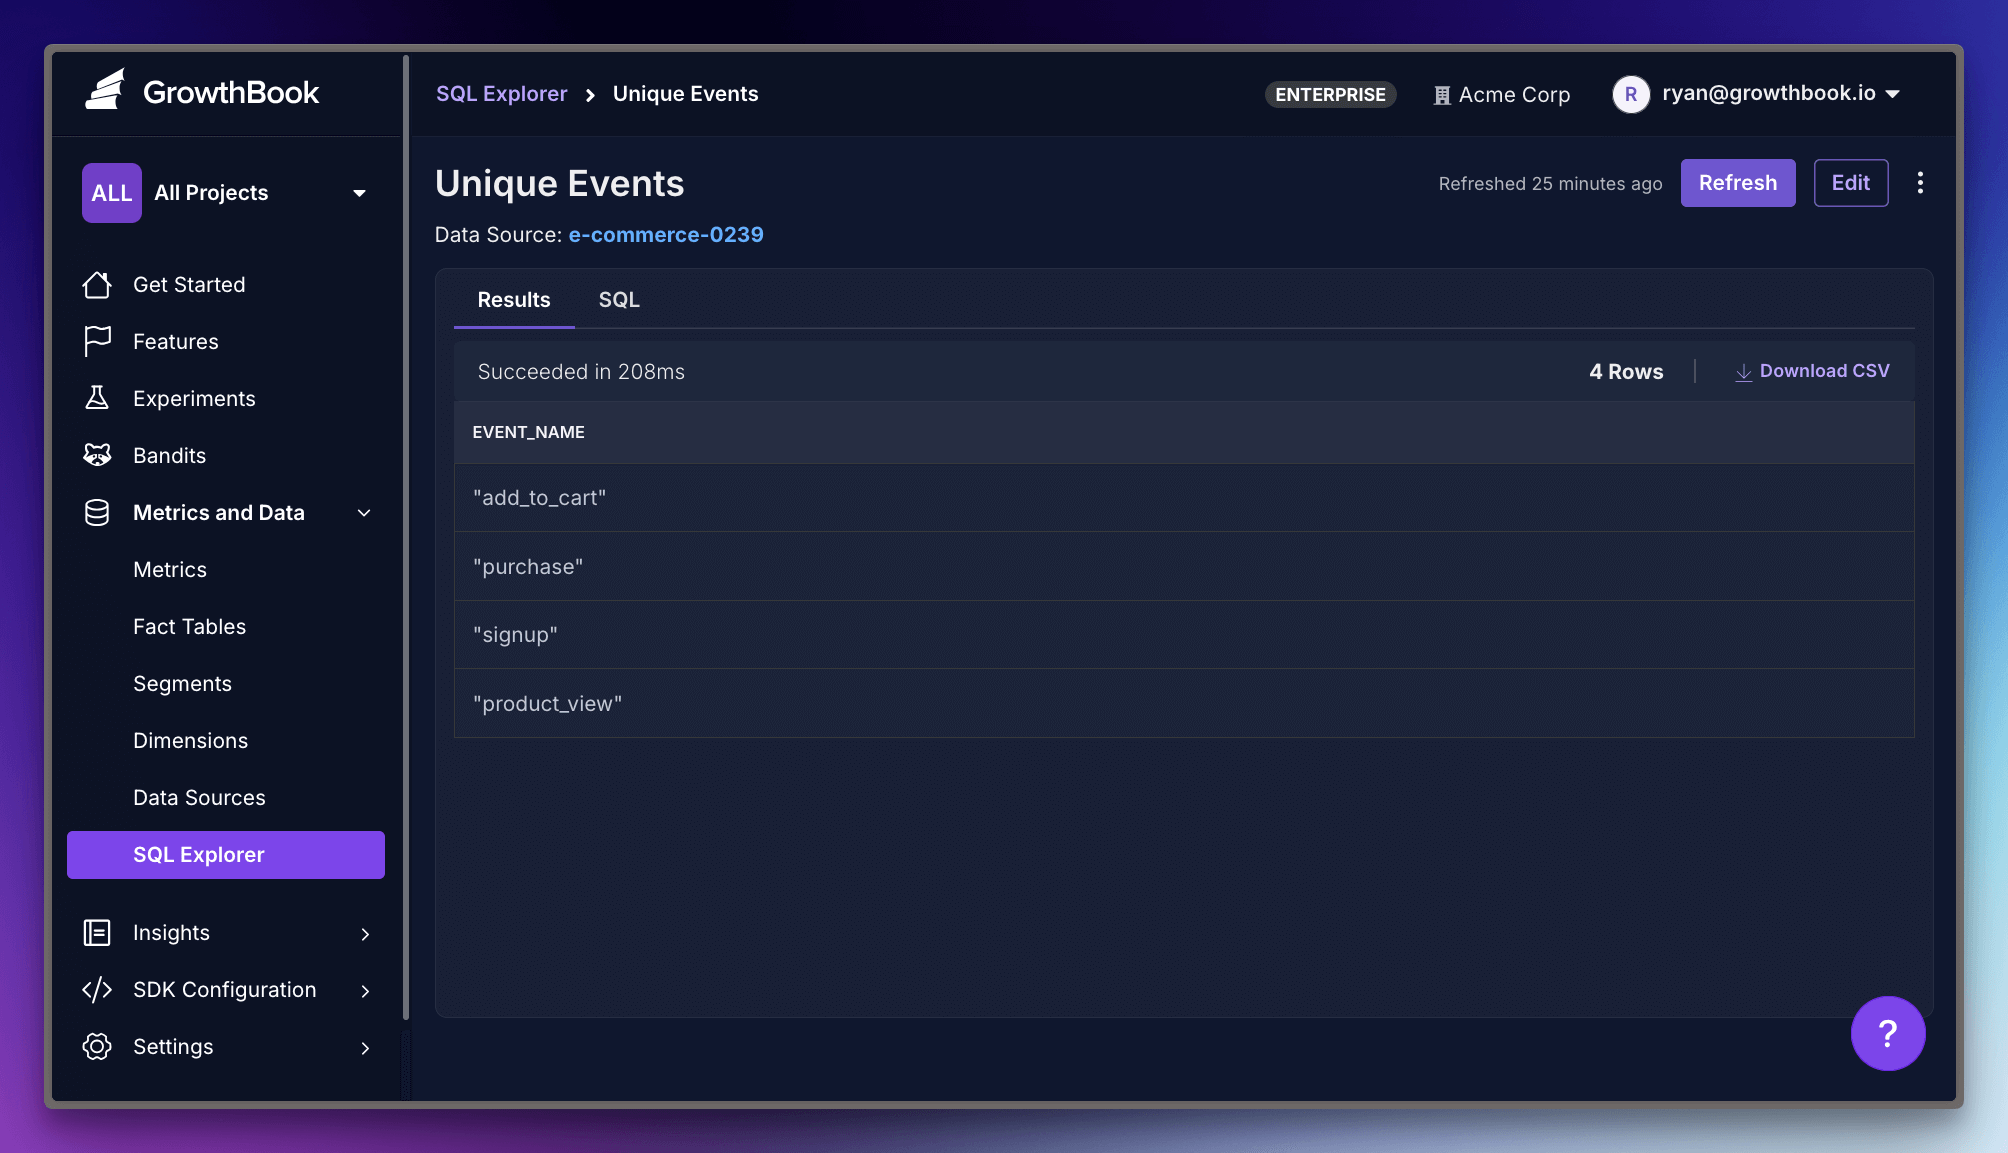
1. Not Like the Other Events
It’s common to have an events table where all your events are unceremoniously dumped. It could be purchase, add-to-cart, sign-up, check-out-started, and so on. But it’s hard to know just looking at the table schema or first few rows what’s really available.
With SQL Explorer, you can just ask:
SELECT DISTINCT
  event_name
FROM
  db.public.events
LIMIT
  1000
Boom! Every unique event name. Save the query and return to it anytime to remind yourself of all your events, cherishing each of them as you do.
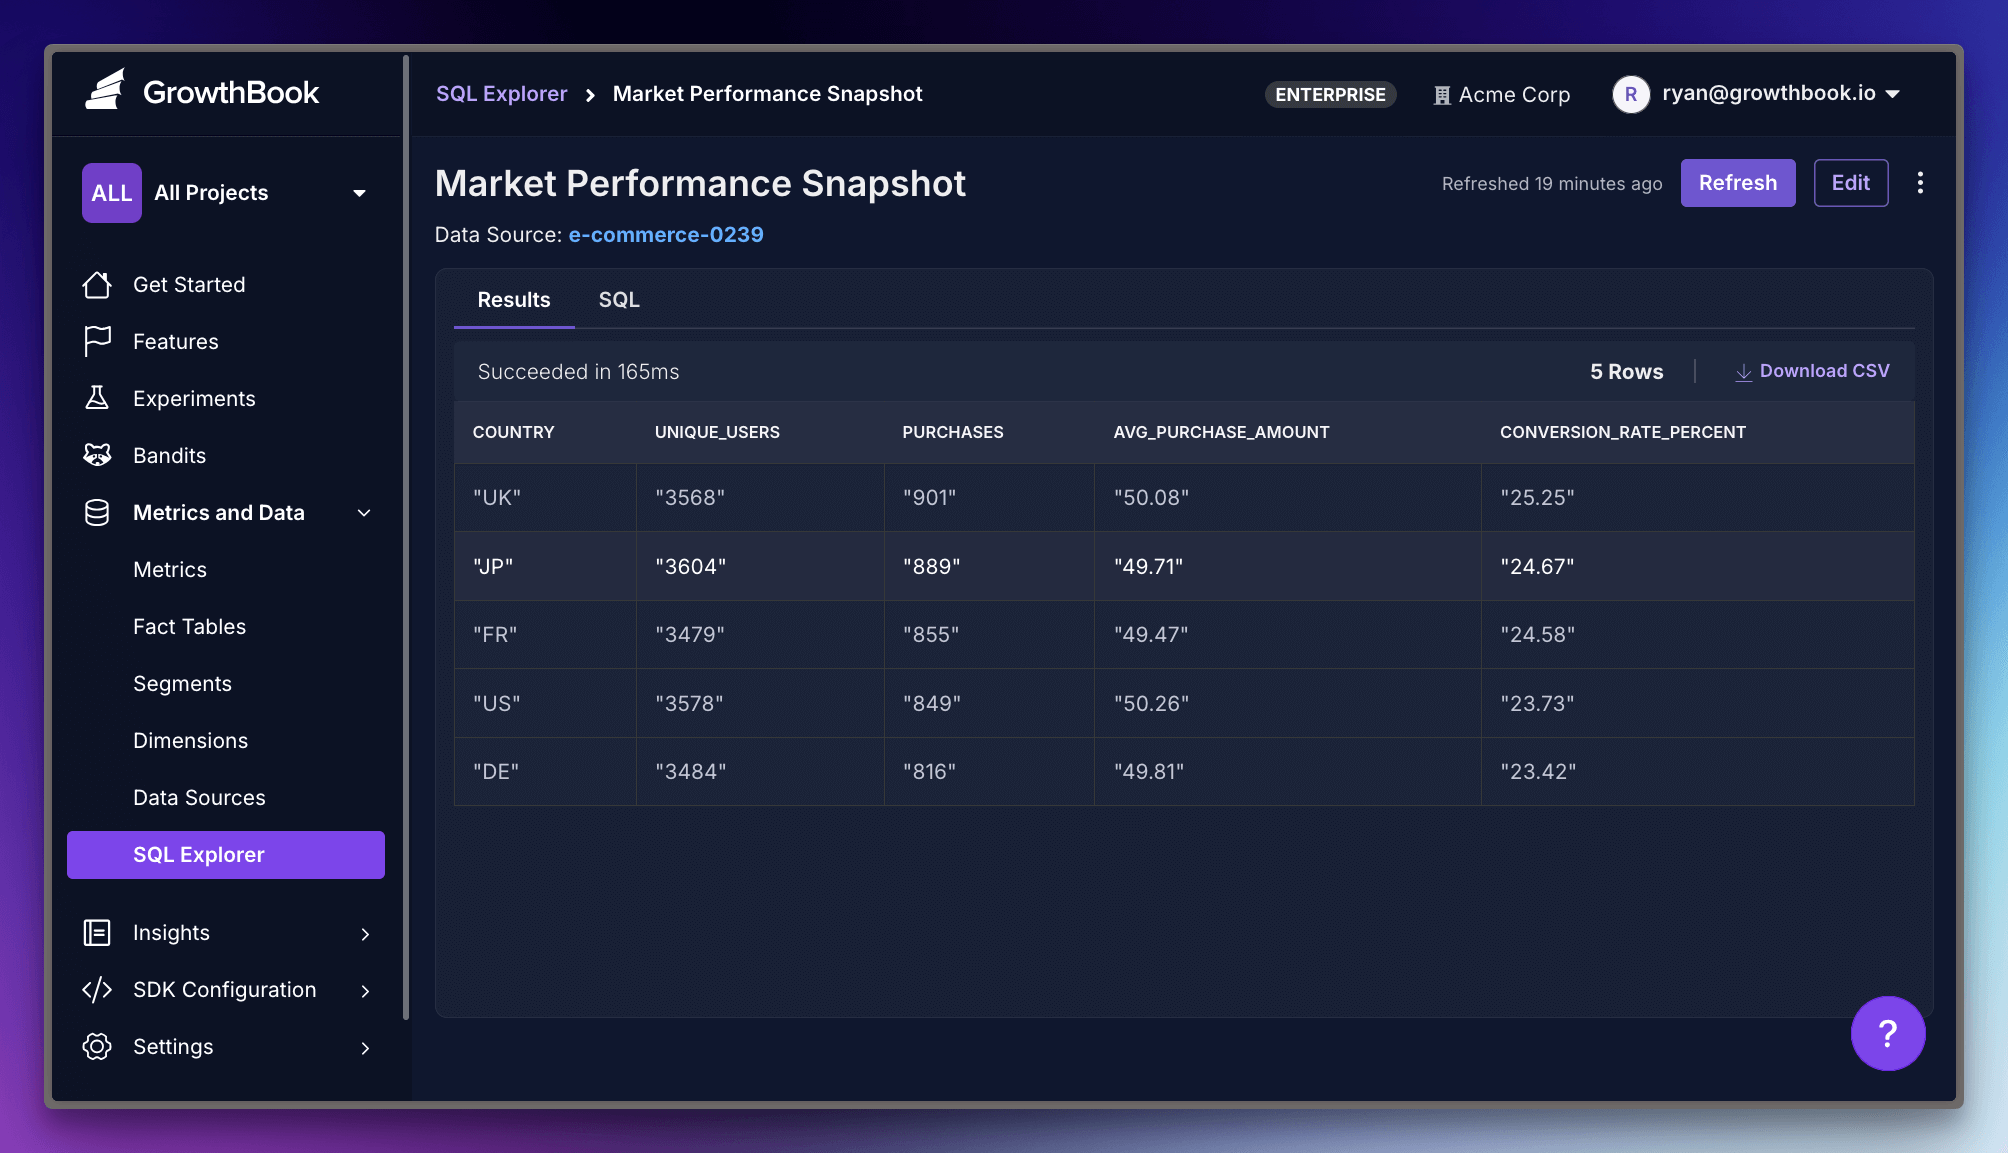
2. The Business Intelligence Deep Dive
Bob from Marketing asked Sally from Product to ask you how conversion rates are doing in Japan compared to your other markets. Lucky for them, you were already checking on an experiment in GrowthBook, so you pulled up SQL Explorer and ran this query:
SELECT
    country,
    COUNT(DISTINCT user_id) as unique_users,
    COUNT(CASE WHEN event_name = 'purchase' THEN 1 END) as purchases,
    ROUND(AVG(CASE WHEN event_name = 'purchase' THEN amount END)::numeric, 2) as avg_purchase_amount,
    ROUND(
        (COUNT(CASE WHEN event_name = 'purchase' THEN 1 END) * 100.0 /
        COUNT(DISTINCT user_id))::numeric, 2
    ) as conversion_rate_percent
FROM events
WHERE timestamp >= CURRENT_DATE - INTERVAL '30 days'
GROUP BY country
HAVING COUNT(DISTINCT user_id) > 100
ORDER BY conversion_rate_percent DESC;
You see that conversion rates are consistent across your regions, and because Bob and Sally are part of your GrowthBook org, you can just share the query directly with them, so they can investigate the data firsthand.
There’s no doubt Bob will invite you to his BBQ this year.
3. Look at This Graph
Rows of data are fine. Who doesn’t love some good rows of data? But sometimes it’s nice to have a chart, too.
With the SQL Explorer, it’s easy to visualize any query as a bar, line, area, or scatter graph.
Imagine you want to see your funnel events from the past 30 days laid out over a gorgeous line graph. You start with the SQL:
SELECT
  DATE (timestamp) as date,
  event_name,
  COUNT(*) as event_count
FROM
  events
WHERE
  timestamp >= NOW() - INTERVAL '14 days'
  AND event_name IS NOT NULL
GROUP BY
  DATE (timestamp),
  event_name
ORDER BY
  date,
  event_name
LIMIT
  1000
Then, add the visualization. Here we choose a Line graph with the date as the X axis and event_count as Y. Finally, we set event_name as the dimension.
And now:

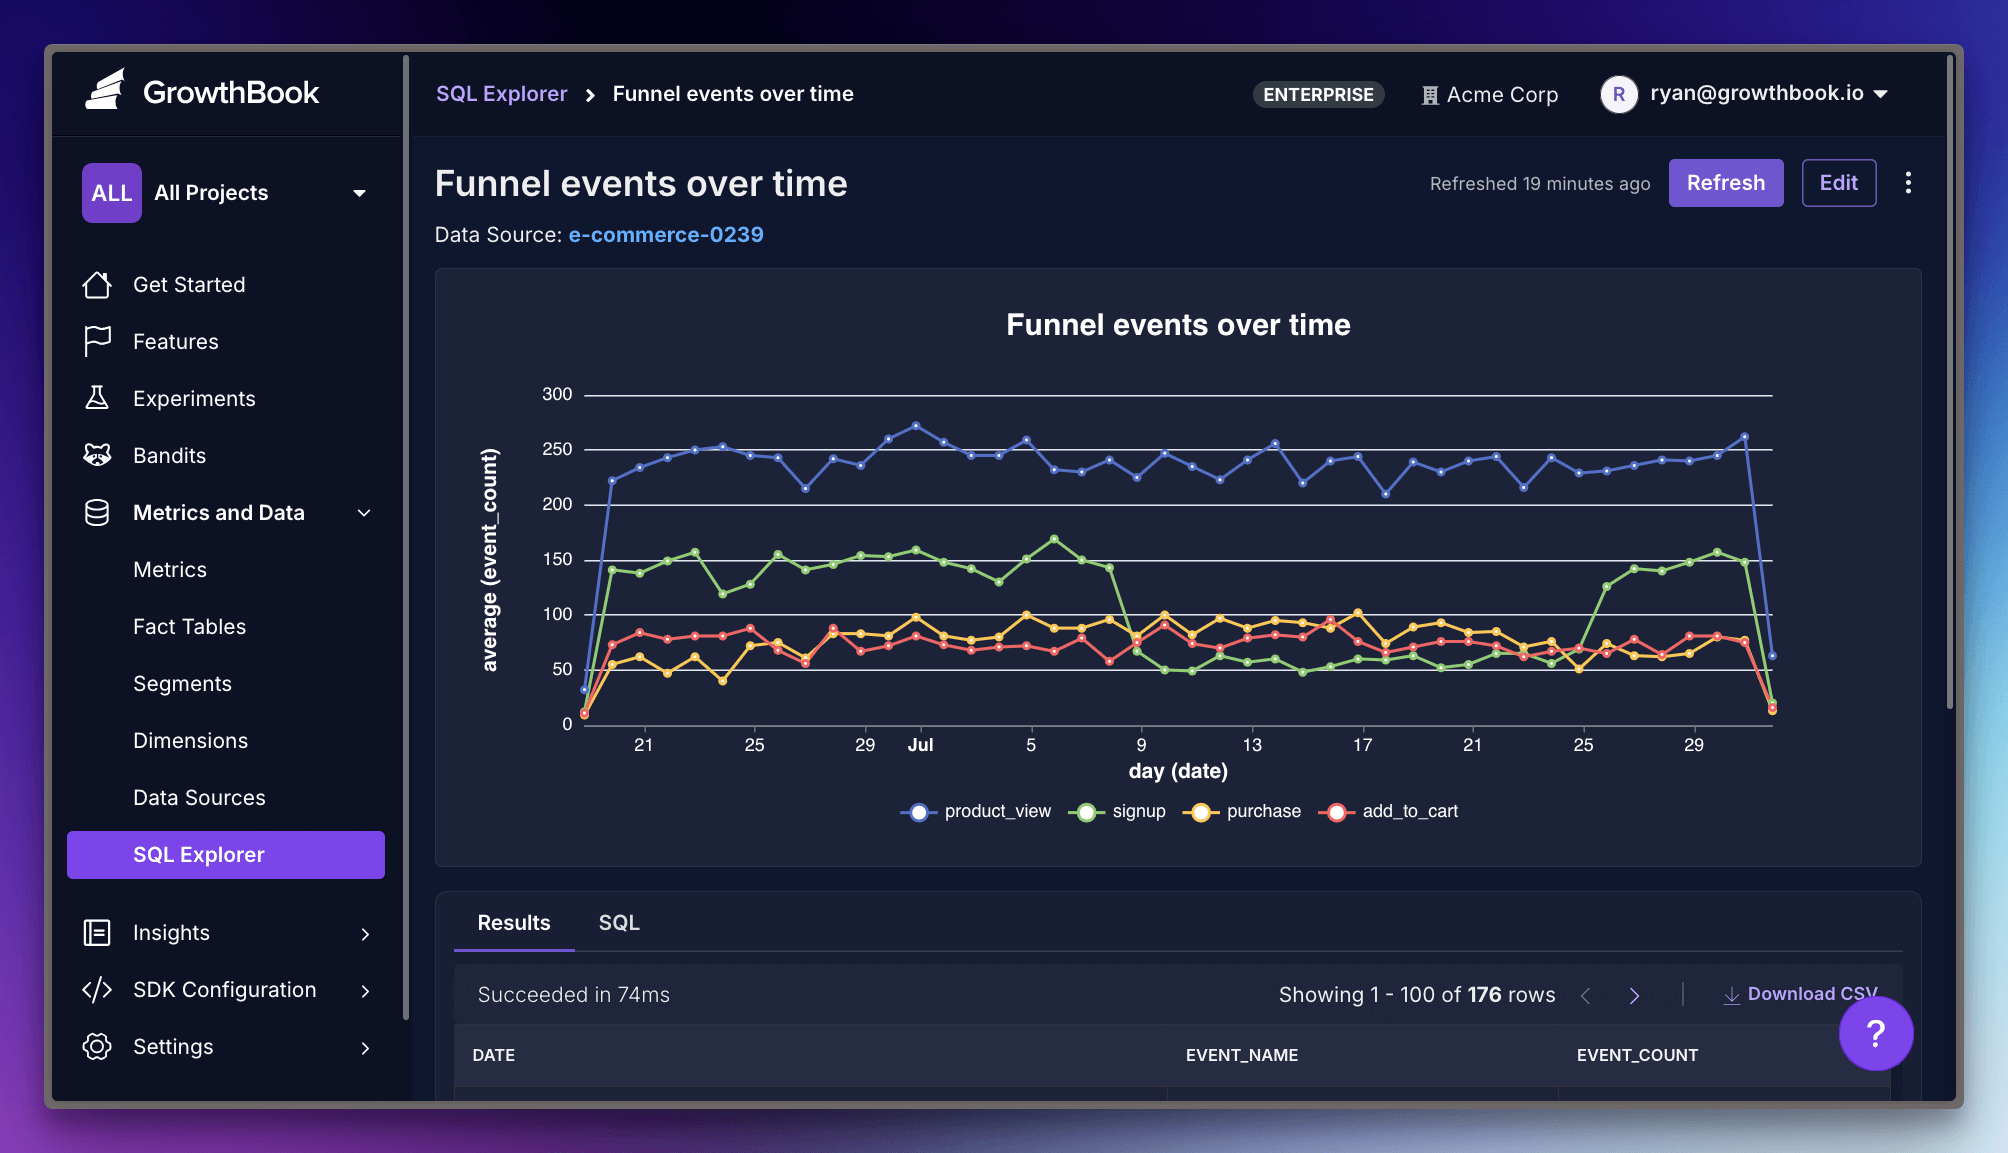
Now you’ve got a sick multi-line chart that immediately shows you if that checkout flow tweak last Tuesday did anything. It did! It made things worse.
The best part? Again, you can save this query and visualization, rerun it whenever, and slack the link to your team. No more screenshots, Loom gloom, or Phil asking for more details on the query.
Phil, now you can just check out the query yourself, bud.
Time to Explore
Your data is already accessible within GrowthBook. Why not explore it? You no longer have to fire up 15 different tools to answer some basic questions about your data.
Whether you're settling office debates about conversion rates, proving that yes, your latest feature actually is being used, or creating visualizations that make you look like a data wizard in Monday's standup, SQL Explorer has your back.
So go ahead, scratch some itches. Your future self (and Bob's BBQ guest list) will thank you.